
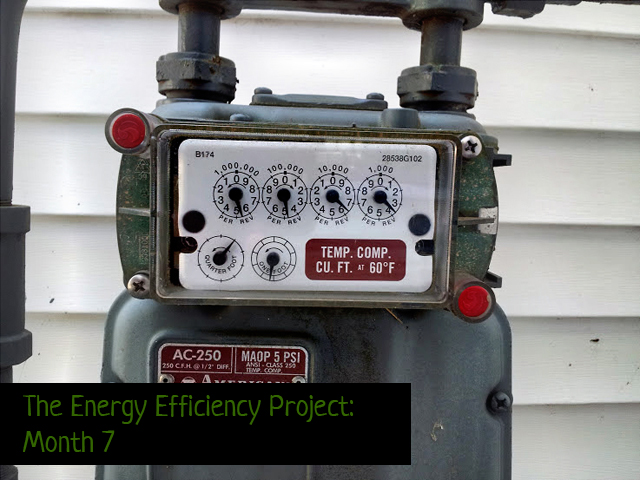
July 13th – August 13th, 31 days
Late July and early August was considerably drier in these parts, so we didn’t have to run our dehumidifier very often. With the dry also came the heat, however, so we definitely were running our ceiling fans for most of this month. On really hot afternoons when the fans just weren’t cutting it anymore I would close up the house and turn on the air conditioner. Once the house cooled down to about 74°F, I would turn off the AC and keep all the windows and doors shut to keep the heat from getting in as much as possible. Usually running the AC for an hour or so would cool down the house until the heat broke as the sun went down.
This month’s upgrade cost: $0.00
Total upgrade cost to date: $26.64
Over 31 days we used 492 KWH. Which comes out to an average 15.9 KWH/day. Compared to the last billing period average of 19.2 KWH/day, you can really see how much electricity that dehumidifier was using while it dried out our basement.
We are part of the Alliant Energy Second Nature renewable energy program, at the 100% level. (In this program you can choose the amount of your energy use that you want to be matched in renewables, and we chose 100%.) The cost of our renewable energy was $0.14 per KWH for this billing cycle, for a total of $69.81
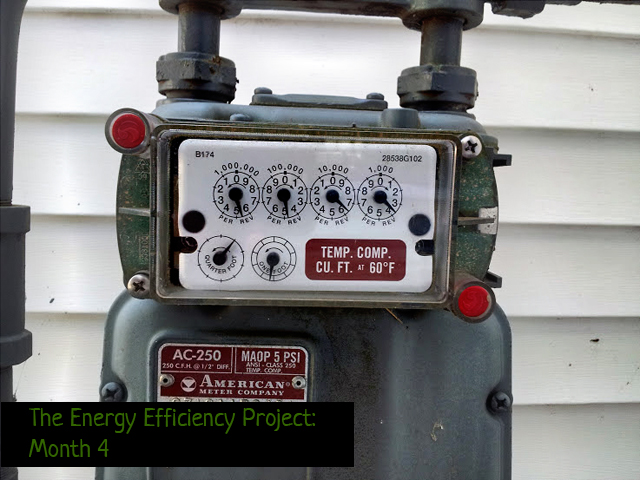
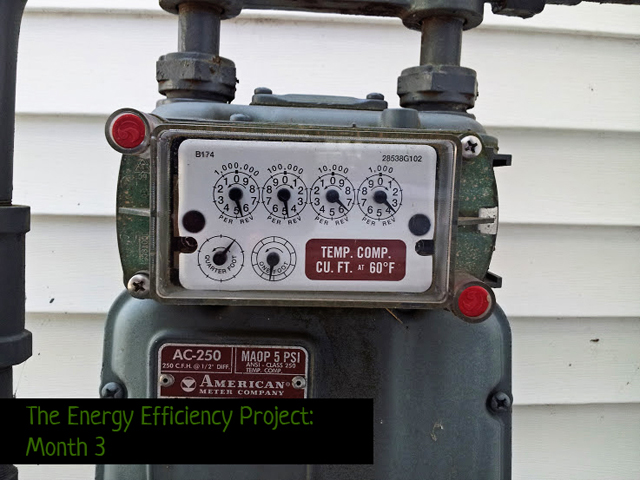
This month we used 0 Therms of natural gas heat energy. Which averages out to 0.0 Therms/day. However we did still have a small charge to keep our gas on this month, and probably also to pay for meter readers and what not. Degree days this month compared to last month: 0 vs. 25
The natural gas market fluctuates in Wisconsin, so there is not an easy dollar per Therm number to give you, but during this billing period we paid $9.90 for our gas use.
Our energy bill also provides these numbers for helpful comparison:
Electricity used this month last year: 159 KWH. This was clearly the month that the previous owners moved out of this house and were just using maintenance electricity while it was on the market!
Gas used this month last year: Unavailable – Again, this is the time the previous owners moved out and put this house on the market, so they may have turned off the gas for the summer. Average temperature this month: 73° F. This month last year: 70° F.
Degree Days this month: 0 vs this month last year: 10. Degree days are the number of degrees below 65° F in one day, all added together for the total 31 days of the billing period.
…
Have you signed up for the building earth newsletter yet? You can do that here!
Want to see previous months of the Energy Efficiency Project? Here is Month 1, Month 2, Month 3, Month 4, Month 5, Month 6, and Month 7.
Keep up with building earth by following us on facebook, pinterest, or on @buildingearth on instagram
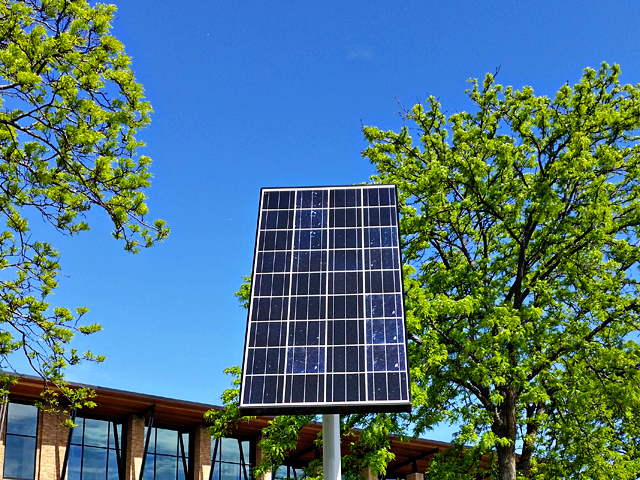
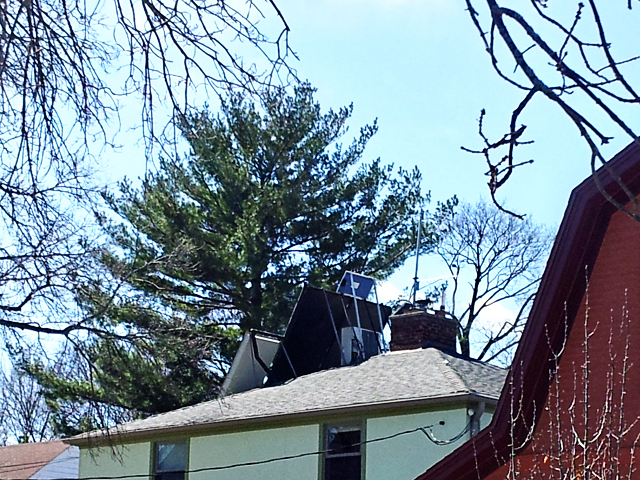
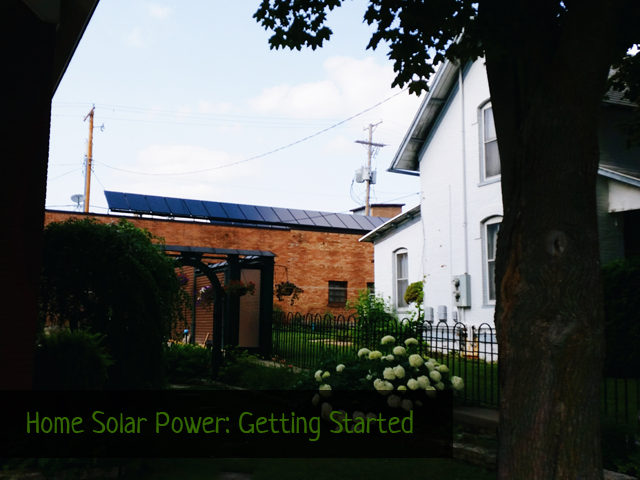 A couple weekends ago I had to opportunity to attend a class entitled “Do It Yourself Photovoltaics” which was put on through our local garden center. The man who taught the class, Mr. Jon Passi, stressed that his goal was to make solar power projects as accessible as possible to others, and encouraged us to share what we learned from his class with our neighbors, so I’d like to share a bit about what I learned with you.